Currently Empty: $0.00

2026-03-06
0 Comments
The global medical vending machine market is projected to reach $825.5 million by 2035 (CAGR 4.36%). For pharmacy operators and healthcare administrators, the critical question is not whether to automate, but how quickly automated dispensing delivers return on investment. This guide provides data-driven ROI analysis with real-world case studies and verified financial outcomes.
The Core ROI Drivers
1. Labor Cost Reduction (The Biggest Impact)
The Data: A health system processing 75,000 daily prescriptions required 862 FTEs using manual processes. After automation, the same volume required just 38 staff—an 89% workforce reduction. Per-prescription labor costs dropped from $2.76 to $0.14, a 96% reduction, with payback under 10 months .
NHS Validation: Sheffield Children’s Hospital saved time equivalent to 4.5 full-time nursing posts through automated dispensing cabinets .
2. Inventory Optimization
The Data: A closed-door pharmacy serving two long-term care facilities achieved:
- 84% reduction in STAT (immediate) medication deliveries
- $26,640 annual savings from reduced delivery costs
- $6,022 one-time savings from on-hand inventory reduction
- Break-even period: 1.4 years
- 7-year net financial impact: $286,946
Additional Evidence: Sheffield Children’s Hospital reduced stock holding levels by 25% through automated visibility .
3. Revenue Enhancement (Retail Applications)
The Data:
- Insurance payment integration increases average transaction value by 156%
- Mobile payment users show 73% higher repurchase rates vs. cash users
- Strategic placement near hospitals: Nighttime sales account for 45% of daily revenue in emergency department deployments
Real-World ROI Case Studies
Case Study 1: Large Pharmaceutical Manufacturer
Deployment: Point-of-use vending units across manufacturing campus.
The Problem: Technicians traveled 40-45 minutes to secure materials from multiple locations.
The Results:Trip time reduced from 45 minutes to 6 minutes,300+ miles in foot traffic saved annually,7+ hours per week reclaimed per technician,$90,000+ annual savings,100% ROI in under 12 months.
Case Study 2:Large Hospital
Deployment: 100+ automated dispensing cabinets across wards, integrated with EHR.
The Problem: Nursing staff spent up to two hours per shift locating medicines and completing registers.
The Results:40 minutes saved per nurse per shift on medication tasks,Reduced controlled drug discrepancies flagged during inspections,£250,000+ annual cost savings from reduced nursing time and wastage,Improved governance achieved within 12 months.
Case Study 3: Retail Pharmacy
Deployment: automated dispensing robot.
The Results:System pays for itself within one year (even for smaller pharmacies),Dispensing time reduced to less than one-third of conventional process,Energy consumption: less than 1 kWh per day.
Location Strategy: The Single Biggest Variable
Scientific site selection increases equipment utilization by over 60% , with monthly sales per location growing up to 300% .
Highest-ROI Locations:
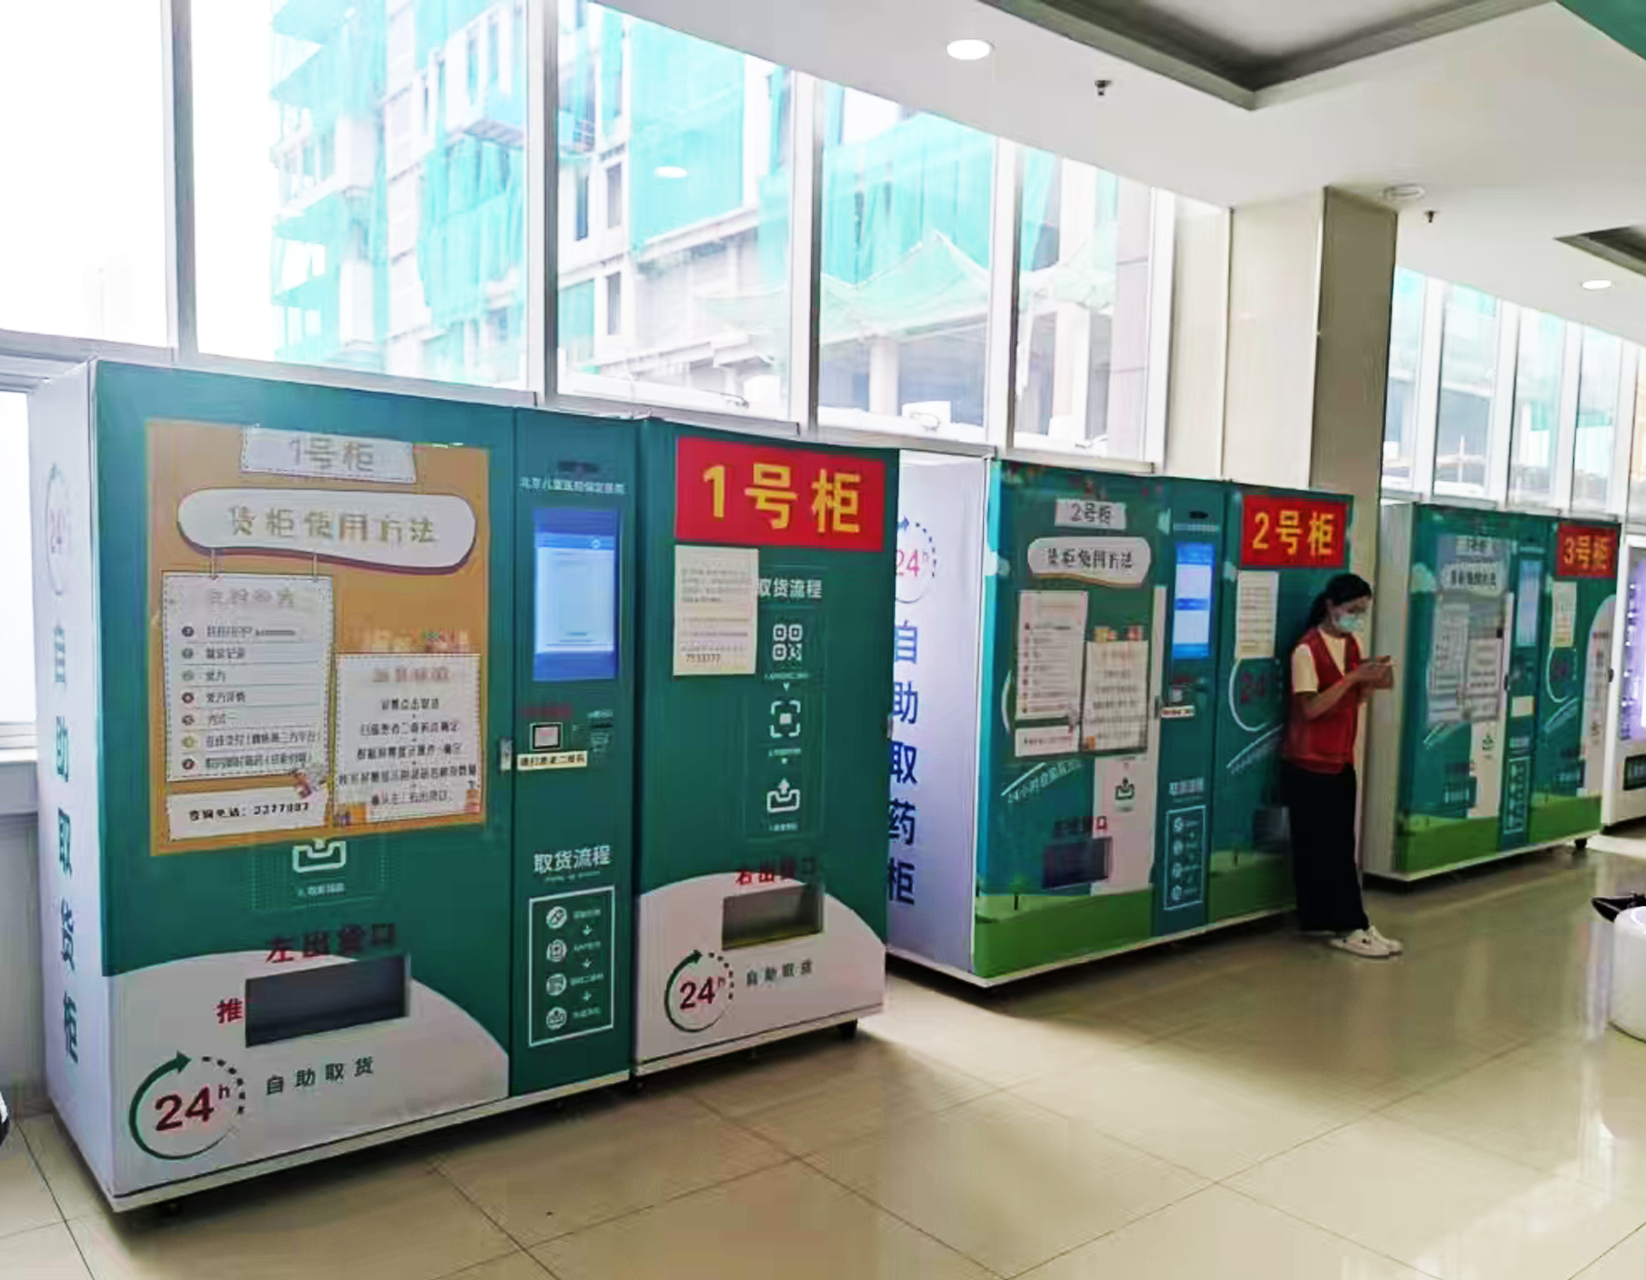
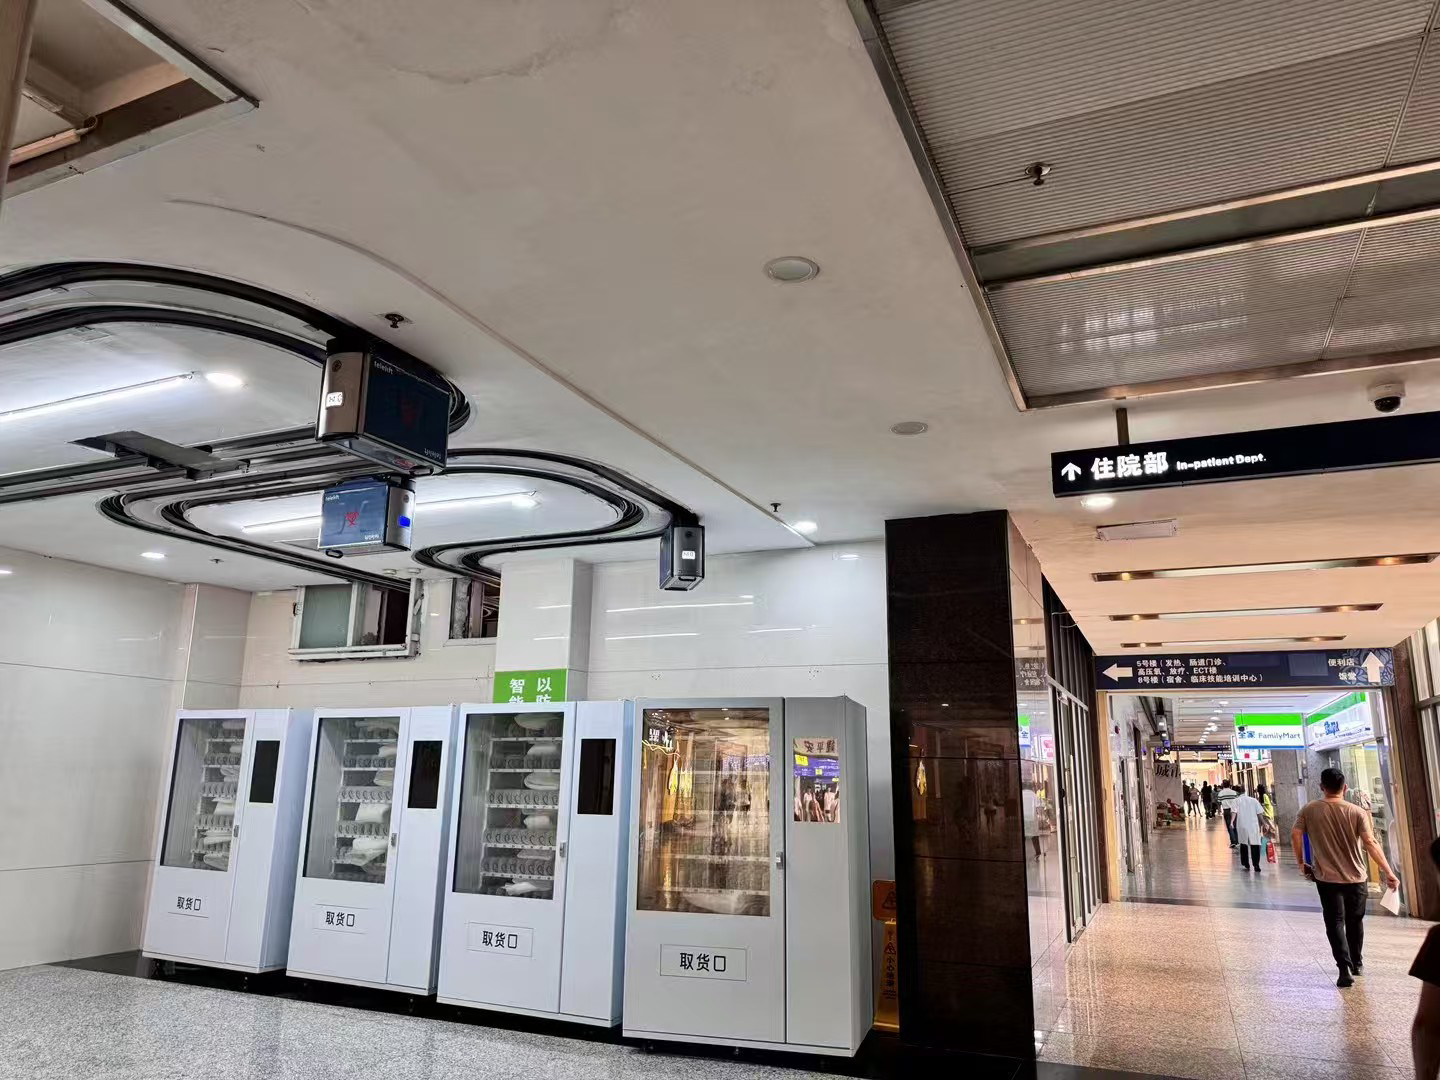
- Within 300 meters of hospitals/clinics: 24/7 demand. Night sales = 45% of daily revenue in ED deployments. Common medicines turn over 2.3x faster than ordinary areas .
- Aging communities: Repurchase rates for chronic medications exceed 82% when integrated with family doctor systems .
- Transportation hubs:
- Airport post-security: Purchase conversion 2.1x ordinary areas
- Highway service areas (holidays): Sales reach 4.8x regular days
Technology Features That Impact ROI
| Feature | ROI Impact |
|---|---|
| AI-driven inventory management | Reduces stagnant product losses by 32% |
| Temperature/humidity monitoring | Improves special medicine preservation to 99.6% compliance |
| Insurance payment integration | Increases average transaction by 156% |
| Mobile payments | Boosts repurchase rates by 73% vs. cash |
| Telemedicine integration | Adds revenue (e.g., ¥12,000 monthly in campus deployments) |

Implementation Challenges (With Solutions)
| Challenge | Mitigation |
|---|---|
| Initial cost: Up to 40% higher than traditional setups | Rapid payback (under 18 months) offsets upfront investment |
| Regulatory compliance: 60% of facilities face strict dispensing rules | Use GSP-certified equipment (achieves 100% inspection pass rates); biometric authentication (growing 30% ) prevents unauthorized access |
| Maintenance: Adds 25% annual cost increases | Predictive AI monitoring; vendor service agreements |
Strategic Recommendations for B2B Buyers
- Prioritize location analysis: Use heat mapping to identify high-traffic areas within 300 meters of hospital entrances. This delivers the fastest payback .
- Start with a pilot: Deploy in 1-2 locations to validate assumptions before scaling .
- Integrate with existing systems: Connect to EHR, inventory, and billing platforms. Interoperability maximizes labor savings and compliance benefits .
- Choose modular, upgradeable systems: Select AI-ready vendors with remote update capabilities.
- Monitor continuously: Sales fluctuations exceeding ±15% should trigger automatic diagnostics. Update SKU configurations quarterly based on consumption data .
The Future Outlook (2025-2030)
By 2025, smart medicine cabinet penetration in primary care is expected to reach 35% . Key trends:
- Non-contact dispensing: +50%
- AI-based inventory tracking: +35%
- Biometric authentication: +30%
- Telehealth-integrated kiosks: +25%
Conclusion
The data is conclusive: pharmacy vending machines deliver measurable ROI across settings. From the NHS Trust saving £250,000 annually to the manufacturer achieving 100% payback in 12 months to the long-term care pharmacy generating $286,946 over seven years , real-world implementations prove that automation is a strategic investment.
With payback periods consistently under 18 months and proven labor savings of 80-96%, the business case for pharmacy vending machines is definitive.